IcloneU is laid out as a left sidebar of surfaces and a main work area to their right. This tour names each sidebar surface and what it's for, then spends most of its time on the Dashboard — the page you land on at every sign-in — because that's where your plan, your health checks and your day's most important numbers all live.
The Dashboard is a presentation layer over data your Clones, Connections and conversations produce. With no active channels and no Clone replies yet, expect most cards to read — or 0 — they fill in as you connect channels and your Clones start working.
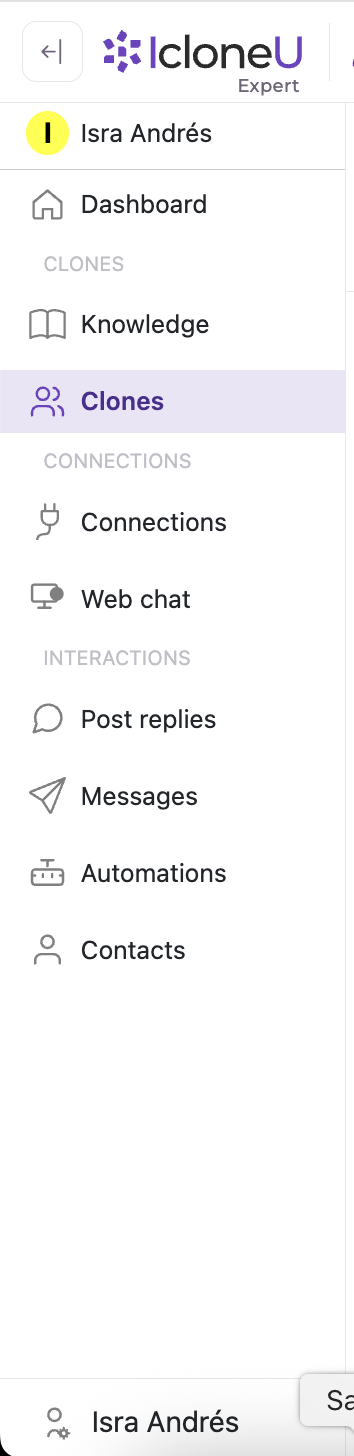
The left sidebar at a glance
Every major surface has a home in the left sidebar. Here's the quick map — each gets a one-line job and, where a deeper guide exists, a link straight to it.
- Dashboard — your at-a-glance home: plan status, system health and today's key metrics. The rest of this guide is its anatomy.
- Clones — the home of every Clone you create: a configurable AI assistant with its own identity, personality, knowledge and skills. New here? See Creating your first Clone.
- Knowledge — your Knowledge libraries: the files, websites and transcripts your Clones read from so replies are grounded in your business. Start with What is the Knowledge Library?
- Connections — the links between your Clones and external channels (Facebook, Instagram, WhatsApp, YouTube, Telegram, Email). Per-channel walkthroughs: Facebook, Instagram, YouTube and more.
- API keys — the embeddable web-chat widget for your own site or app, powered by one of your Clones and configured per API key. This one is plan-dependent: the web-chat widget starts at Pro, so a Starter account has no API keys entry in its sidebar at all. See Embedding web chat on your site.
- Post replies — manages your Clone's replies to comments on your social posts (Facebook, Instagram, YouTube only); it's where comment replies held for your approval wait.
- Messages — the unified inbox of every conversation your Clones have across all channels, where you can read transcripts, give feedback, or take over from the Clone — and where direct-message replies held for review wait for your approval.
- Automations — the Workflows builder: visual, multi-step automated flows your account runs on triggers. Start with What are Automations?
- Contacts — the people your Clones have talked to, as records you can filter, segment, tag, import and export. See Managing contacts.
- Reviews — where customer reviews are collected and worked: the reviews themselves, the items being reviewed, review requests, Q&A, staff mentions, testimonials and their settings, each on its own tab.
Contacts and Reviews sit in the sidebar's Interactions group alongside Post replies, Messages and Automations, and they're part of every paid plan. If you don't see one of them while you're on a paid plan, it's a role thing — a team member needs the matching permission before the entry appears. Both entries also disappear while an account has no active subscription (after a failed payment, for example), so check Billing first if nobody's permissions changed. See Managing team members and roles.
The top bar
Above the work area runs a slim top bar, present on every page. Left to right, its eight elements:
| Element | What it does | What it opens |
|---|---|---|
| Collapse / expand | Folds the left sidebar away or brings it back | — |
| Logo + plan chip | The IcloneU logo with your current plan's name beside it | The logo links home |
| Location breadcrumb | Icon and name of the module you're on, read from the page's URL | — |
| Search | Global search across pages, contacts and help | The results dropdown |
| Help Center | Opens the Help Center; repeat clicks reuse the same browser tab instead of stacking duplicates | The Help Center, in its own tab |
| Notifications | Bell with an unread-count badge, updated live | The notifications panel — mark as read, dismiss, dismiss all |
| Report a problem | Red button with a BETA badge for filing an issue | The issue-report form, in a new tab |
| Account avatar | Your account menu — name, email and plan chip up top | Account settings, Team, Plan and Log out |
Two details that surprise people: the logo and plan chip only show while the sidebar is expanded — collapse it and they disappear — and the breadcrumb simply doesn't render on pages whose module has no display title. Also, Log out here and the user row at the bottom of the sidebar open the very same menu.
The support chat bubble
Bottom-right on every page floats a purple chat bubble. That's our support channel — powered by the very same Web chat product you can embed on your own site. If you're signed in, it already knows who you are, so there's nothing to identify. Want the same widget for your customers? See Embedding web chat on your site.
Anatomy of the Dashboard
When you sign in, IcloneU drops you on the Dashboard by default — and you can return any time by clicking Dashboard in the sidebar. Its content stacks top to bottom in four bands: the greeting and plan banner, the System Health card, the KPI strip, and the larger section blocks. We'll take them in order.
This is the quick tour. For a card-by-card guide to every KPI, what the colored pills mean (and the difference between a trend and an attention flag), Today's Focus, and every chart, see Understanding your dashboard.
Greeting and plan banner
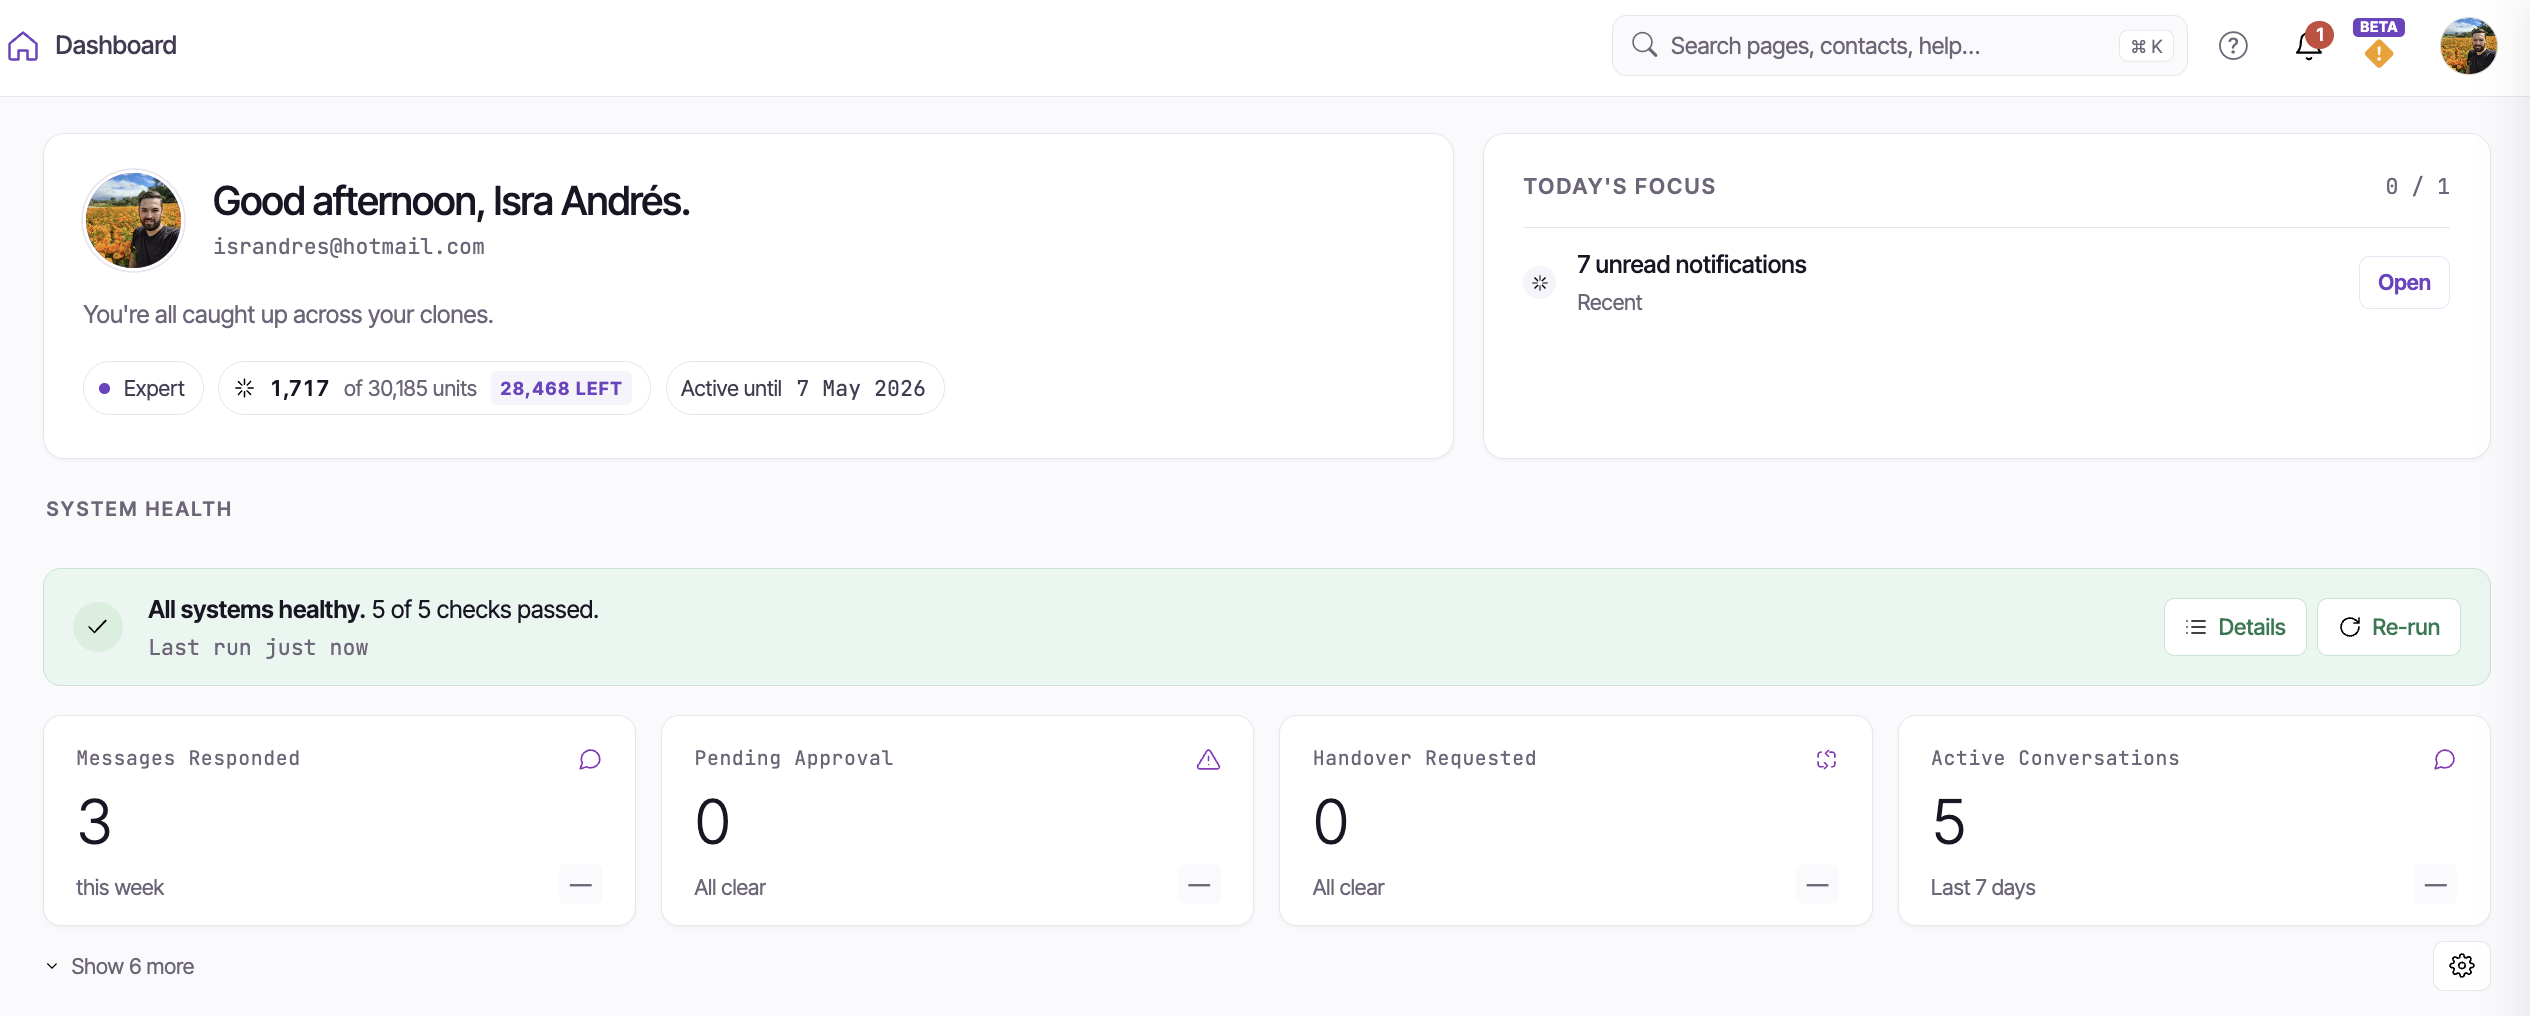
At the very top sits a time-of-day greeting — "Good morning, <your name>." (with no name set it's simply "Good morning." — your email shows on the line below, never in the greeting itself) — with a reassuring "You're all caught up across your clones." Below it, a plan row shows your tier badge (e.g. Expert), your monthly units in the form "104 of 2,500 units / 2,396 LEFT", and an Active until date. On the right of this row is a TODAY'S FOCUS card with a small progress counter and any actionable items, each with an Open link.
NoteThe banner's Active until date is your plan's period-end (renewal) date — the same one shown in the Your plan section on the Your details tab of Account settings. The unit counter here mirrors the authoritative balance in Billing.
System Health card
Next is the System Health card, which reports the status of platform checks — connections, Clones and knowledge sources. When all is well it reads "All systems healthy." with an "X of Y checks passed" summary and a "Last run" time; while a check runs you'll briefly see a "Running health checks…" state. Two buttons sit alongside: Details opens the per-check breakdown, and Re-run re-runs them on demand.
KPI strip
Below that is the KPI strip — a row of small metric cards. The first four are always visible: Messages Responded, Pending Approval, Handover Requested and Active Conversations. A Show more link (which shows the count of hidden cards, e.g. Show 7 more) expands the rest of the cards, and a gear icon at the end of the strip opens the Customize Dashboard modal (covered below).
Section blocks
Finally come the larger section blocks. The Lead & Contact Intelligence group holds a Lead Pipeline (Cold / Warm / Hot / Qualified / Converted / Lost stages, plus conversion and score summaries), Contacts by Platform (a donut reading "N contacts across M channels"), and Recent Buying Signals (which starts at "No buying signals detected yet"). Further sections cover engaged contacts, usage, messaging activity and response analytics — all reorderable or hideable.
Reading the KPI strip
The four always-on cards answer the question "is anything waiting on me?" at a glance. Here's what each one tracks:
| Card | What it tracks |
|---|---|
| Messages Responded | Replies from your side, by your Clones or your team, whether or not they went out (last 7 days) |
| Pending Approval | Replies to post comments held for your authorization before they send — "All clear" when none wait. Held direct-message replies aren't counted here; they wait in Messages |
| Handover Requested | Conversations where a human takeover was requested — "All clear" when none |
| Active Conversations | Conversations active over the last 7 days |
Click Show more to reveal additional cards — things like Total Contacts, Active Leads, Conversion Rate and Unread Notifications. You don't have to keep them all; the gear icon lets you choose which appear and in what order.
If a card occasionally renders with no title or value after you expand the strip, that's a transient state — refreshing the page clears it.
Customizing the Dashboard
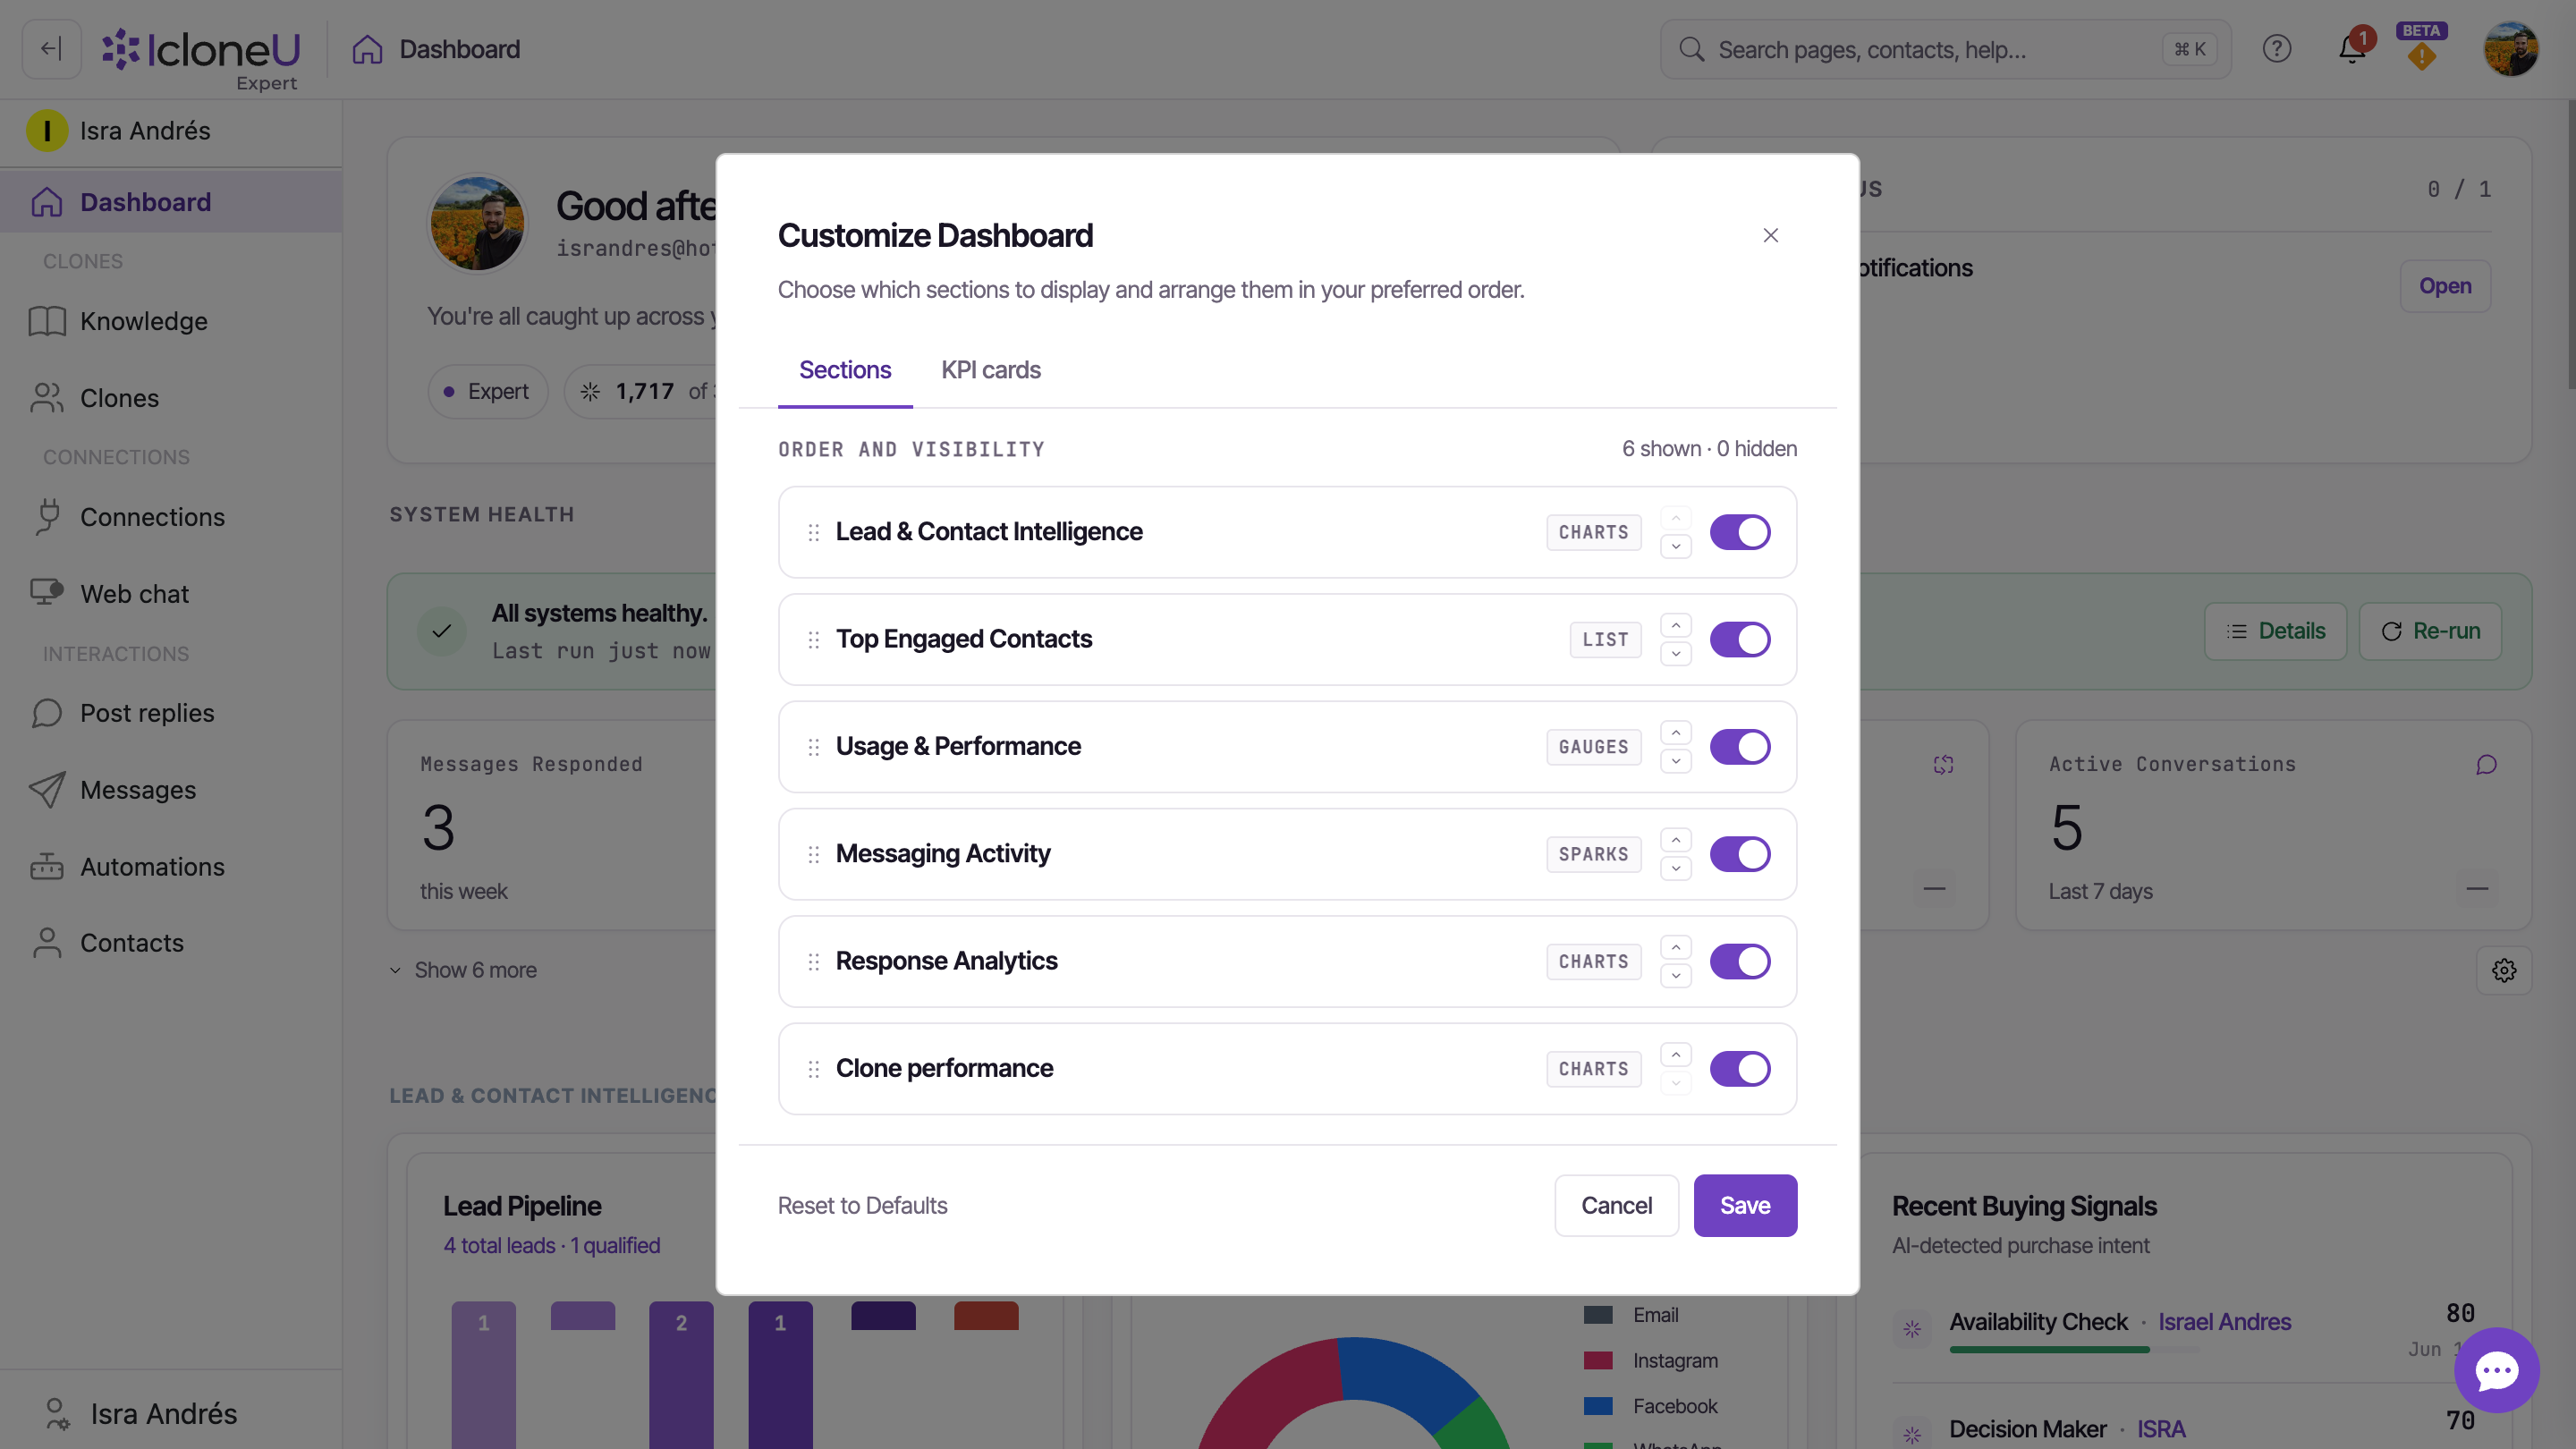
The Dashboard is yours to arrange. The gear icon at the right of the KPI strip opens the Customize Dashboard modal, which has two sub-tabs:
- Sections — toggle and reorder the large content sections (Lead & Contact Intelligence, Top Engaged Contacts, Usage & Performance, Messaging Activity, Response Analytics, Clone performance). Each row carries a drag handle, a visibility toggle and a type badge.
- KPI cards — toggle and reorder the small strip cards. The first four sit in a TOP 4 tier (always above the fold); the rest live behind Show more.
Open the modal
Click the gear icon at the right end of the KPI strip to open Customize Dashboard.
Toggle and reorder
Switch to the Sections or KPI cards sub-tab, then use each row's visibility toggle to show or hide it and its drag handle to reorder. A Reset to Defaults link restores the out-of-the-box layout.
Save your changes
Changes only take effect after you click Save. Closing with Cancel discards them — your layout stays as it was.
The IcloneU mobile app
IcloneU has a phone app for keeping up with your Clones away from your desk: get it from the App Store or Google Play. The app doesn't create accounts or sell plans. Your account, plan and team are set up here on the website, and you sign in to the app with the same login.
- Android works on every plan.
- iPhone and iPad work with Enterprise accounts only, by design. Any other account is turned away at sign-in with "This app is available for organization (Enterprise) accounts only. Individual users can access IcloneU at icloneu.ai from a web browser."
- Signing in: email and password or Google, and on iPhone and iPad also Apple. Google and Apple work only when their email matches an IcloneU account that already exists. A forgotten password is reset by email, and the reset finishes in your browser.
- Team members sign in with their own login once they've accepted their invitation; their role decides whether they get the Post Replies and Messages tabs.
Inside, three tabs cover the day-to-day: Dashboard for your key numbers, Post Replies for the replies to comments, and Messages for conversations, where you can approve held replies, take over a conversation and hand it back to your Clone. The bell opens your notifications. Clones, Knowledge, Connections and your plan are managed on the website.
Where to go next
Now that you know the lay of the land, here's the natural order to set things up — and the guide for each step:
- Build a Clone: Creating your first Clone.
- Give it knowledge: What is the Knowledge Library?
- Put it on a channel: Assigning a Clone to a platform, or embed it on your site with Embedding web chat on your site.
- Keep an eye on what it sends: Reviewing and editing AI responses.
Frequently asked
Because the Dashboard reflects real activity. With no Connections active and no Clone replies yet, most cards show — or 0. They populate as you connect channels and your Clones start handling conversations.
Yes — that date is your plan's period-end (renewal) date, the same one shown in the Your plan section on the Your details tab of Account settings. The units-cycle reset is a different date: it lives in Billing, inside the Plan units remaining box, as a Resets… line.
Yes. The gear icon at the right of the KPI strip opens Customize Dashboard, where the Sections and KPI cards sub-tabs let you toggle, reorder and reset the layout. Changes apply only after you click Save.
Messages is the unified inbox for direct/private conversations across every channel. Post replies handles your Clone's replies to comments on social posts, and only for comment-capable channels — Facebook, Instagram and YouTube. A Telegram or Email exchange shows up in Messages, never in Post replies. Held replies follow the same split: comment replies held for approval wait in Post replies, while held direct-message replies wait in Messages.
Last updated October 6, 2026 · Getting Started